"Participation in our digital society requires the transmission and storage of sensitive personal information that inevitably seems to be leaked, abused or hacked."
Every year since 2005 Nicholas Felton has produced an Annual Report about himself and his life. He has gathered together various bits of information to form a database of his personality, habits and relationships. We interviewed him ahead of Big Bang Data.
When did you first begin to explore the process of documenting your life through data. What initially inspired you to create Annual Reports?
It was the end of the year and I wanted a way of wrapping it up. The idea of calling it an Annual Report was kind of incidental. I received a response online which was pretty surprising to me. Strangers expressed an interest and it encouraged me to keep going, delving deeper to find out what other information I could learn out about myself.
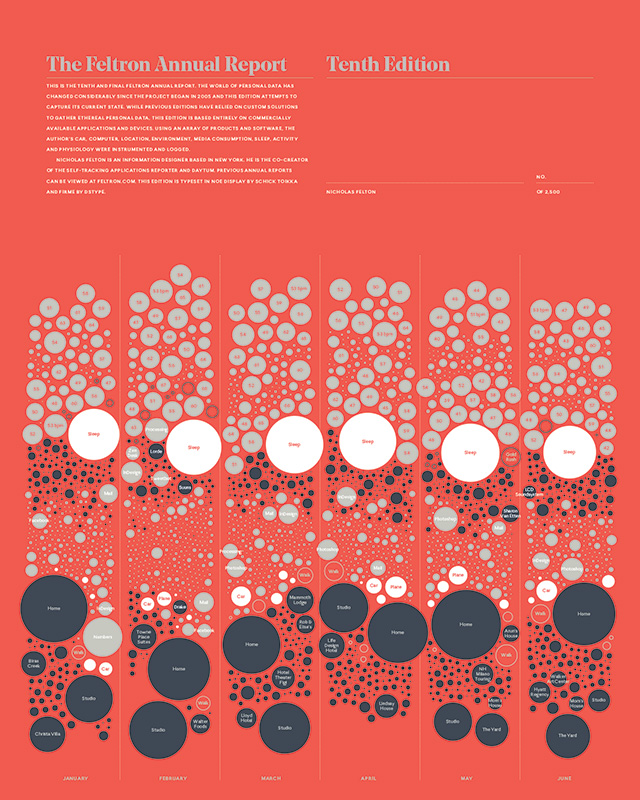
The Feltron Annual Report, Tenth Edition, feltron.com
In October you filed your final Annual Report, how did it feel to complete the project?
The last ten years have been really interesting. We’ve seen personal data expand and multiply. I’ve been fortunate to have a project that has benefited from this explosion of data. It feels great to have pursued this project to maturity and to finally see it come circle by using commonly available data.
Have you uncovered any data which portrays an element of your life that was a surprise?
One of the most interesting data sets that I started working with last year came from a breathalyzer, so each time I was drinking I would check my blood alcohol. It’s a piece of personal data that has very important legal ramifications, that’s just completely opaque to nearly everyone. It was really interesting to get a sense of what my blood alcohol level was throughout the year and then be able to train myself and recognize different intoxication levels.
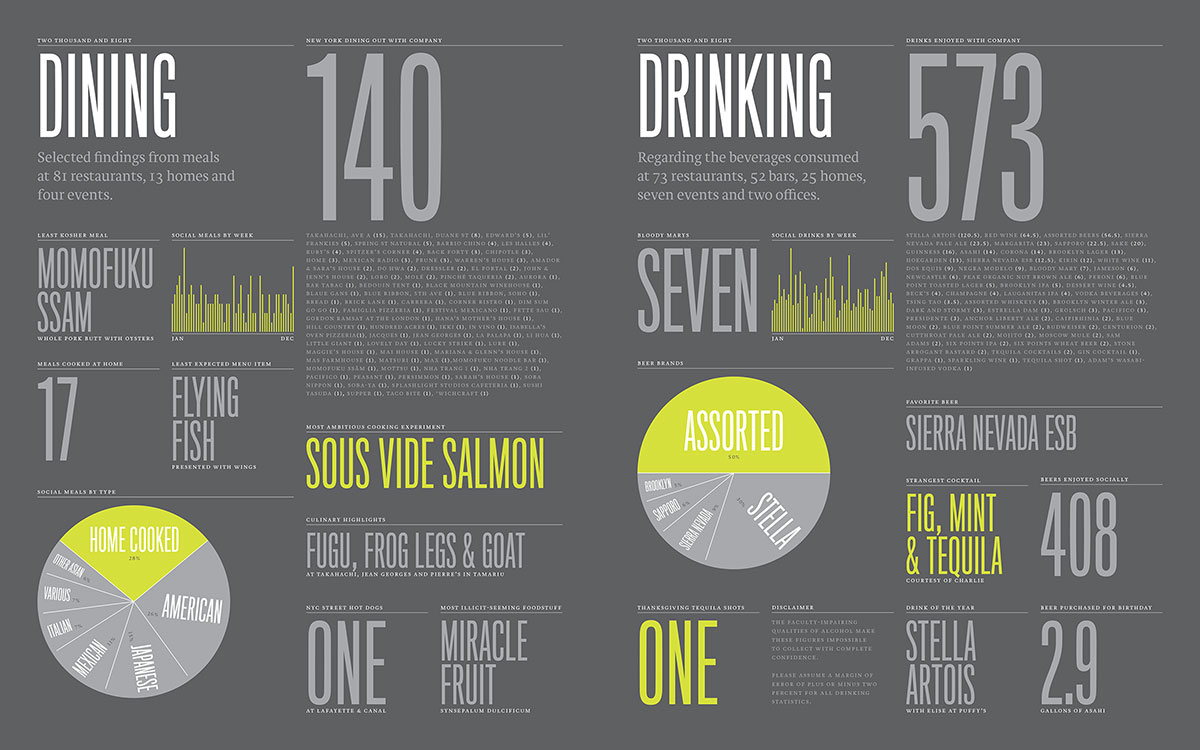
Annual Report, 2008, Nicholas Felton, feltron.com
Did it have an impact on how much you drank?
I think it impacted how much I drank and the project as a whole has had an influence. Self-tracking has added a mindfulness to my life, exercise, consumption, by making me think more about the actions I take and the things I consume.
You have previously spoken about the huge change that has taken place over the last ten years in terms of personal data. Which key moments do you think have propelled this change?
The biggest change in personal data has been the proliferation of smartphones. The increase in their power has been really transformative. These devices know so much about us, and so much more can be inferred about our behaviour from it. For most people, the trade off between keeping a phone online and powered and with us all the time has been worth it, but has also provided all these monitoring opportunities. The sad state of affairs is that this monitoring power has mainly been exploited by 3rd parties rather than the owners of these devices.
What steps do you go through when designing the Annual Reports?
I hold off on looking at the data until the year has come to an end before digging into it. There is something nice about having a year of meditating on this collection process. It gives me time to come up with some hunches or things that I want to explore. By the end of the year, I am usually pretty eager to start figuring out if my speculations about the data sets are correct or if there are any patterns lurking in them that I would not have anticipated.
Everyday we are creating endless data, what methods did you use to document, and analyse the data?
For the last seven or eight years I have changed my approach every year. Creating a new focus each year has required me to come up with different methodologies. In 2009 I asked other people about what I did. In 2012, I played with sampling rather than trying to collect everything, and developed an app called Reporter for that purpose. I used another app called Fulcrum in 2013 to capture all my conversations, so it’s really just based on the year and what I’m interested in capturing.
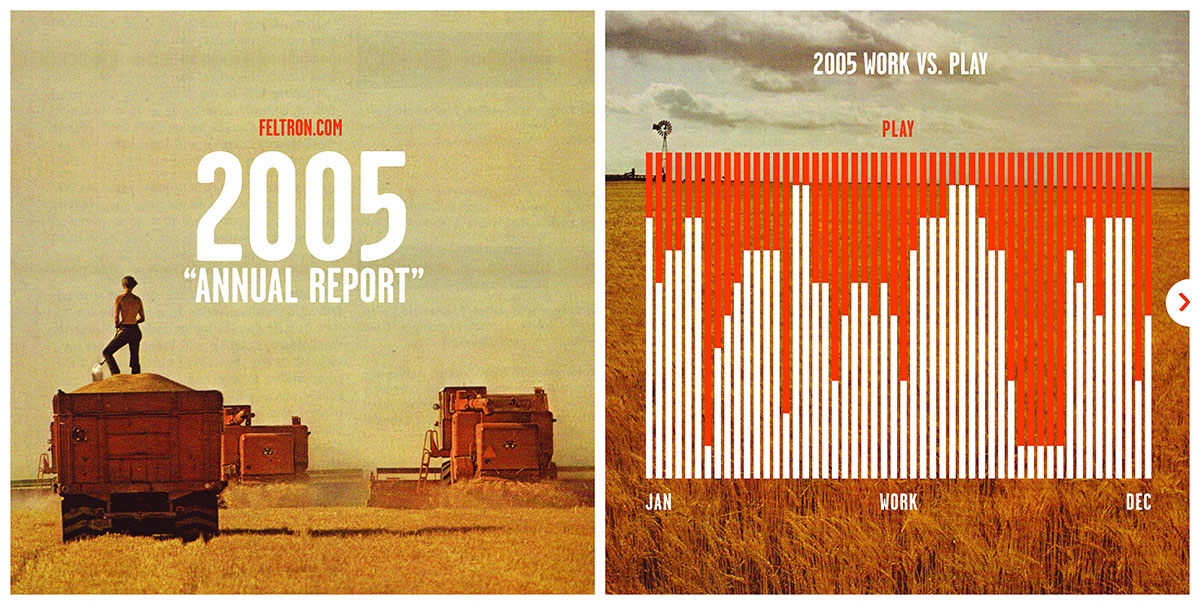
Annual Report 2005, Nicholas Felton, feltron.com
Which tool / apps did you use in Annual Report which you found most beneficial to your daily life?
The Reporter app has been very useful. It operates by sending you randomly timed notifications that prompt you to fill out a survey. One of them is, ‘what do you need?’ This survey encourages me to think about my needs at the time, whether I need some water, some food, or a break and it’s a recentering moment. It also asks me if I am working or not, so if I’m not working and I’m messing around on the internet it’s a good reminder that I should get back to work.
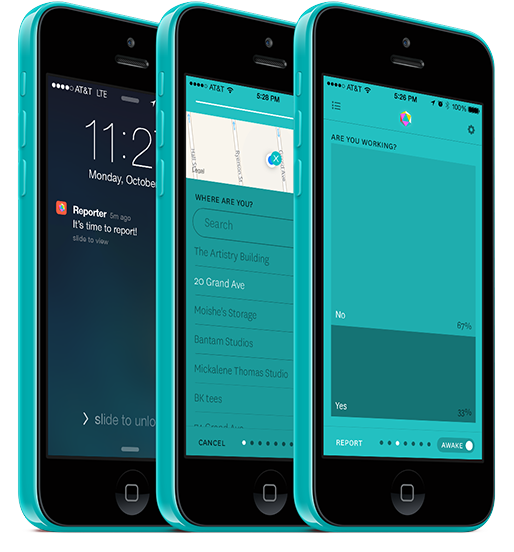
Reporter App, reporter-app.com
You were a lead developer working on the Facebook Timeline – What was your approach for designing that and how did your own vision for data influence the direction?
The timeline design approach was informed by some of the archaeological work I’ve done for several years of the Annual Report. This happened when I looked at my father’s life, and in the first year when I built a report. With these projects you are given a data set and you’ve got to dig into it to discover what’s interesting. This was the same with Facebook posts. We had to figure out what were the most interesting ones, and what other information could be pulled out to start to connect them, such as location or people.
In terms of personal security and privacy, what do you think are the downfalls for sharing personal data?
When people are explicitly sharing things, like photos or tweets, I hope that they understand the consequences of revealing that information. What is troubling is that participation in our digital society requires the transmission and storage of sensitive personal information that inevitably seems to be leaked, abused or hacked.
You have developed apps such as Daytum with Ryan Case which calculates and communicates personal data, and the survey orientated Reporter app for users to measure elements of their life. How can data be used to for the greater good by individuals?
The general intention of my work is to help people see the aggregate picture of themselves, rather than the individual moments. I think it’s really hard to understand the big picture of our behaviour. Seeing your weight on a graph over time is very different to moment to moment basis and the self-rationalisation that accompanies it. I hope the products that I build in the future help people view the whole of their actions to understand how they may be impacting their happiness, health and well-being.
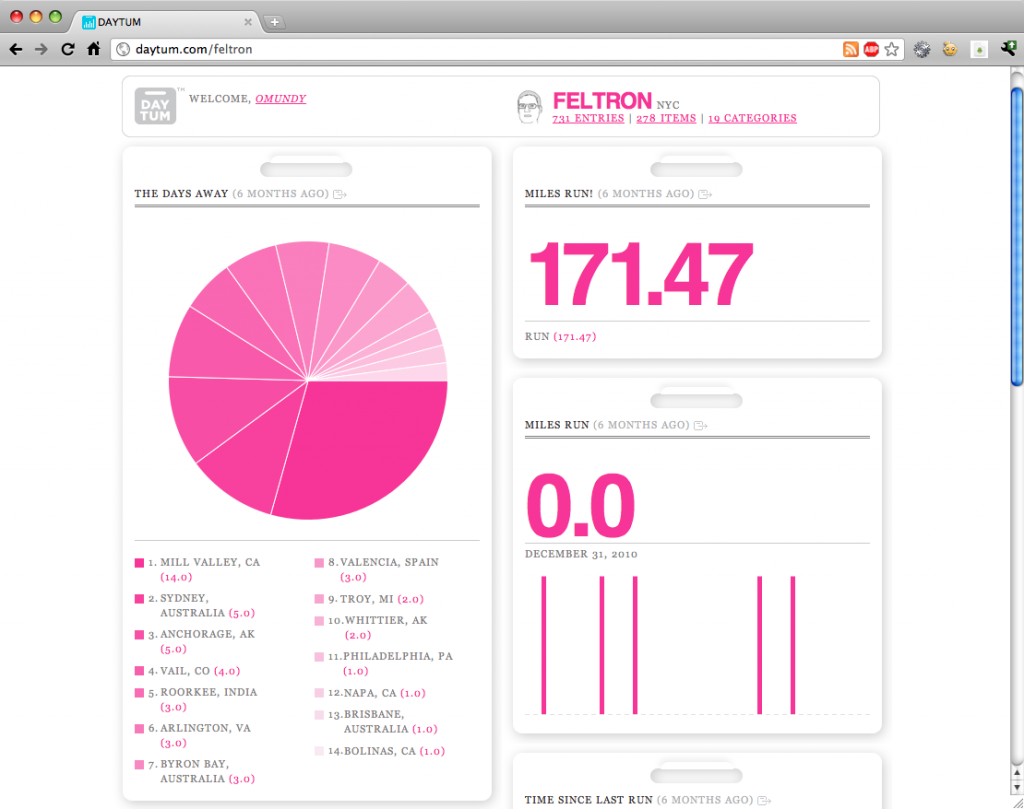
Daytum, daytum.com
If you had unlimited access to any data sets out there which would analyse and why would it excite you?
I would really love to get my hands on the Kindle data set. I think it’s a small tragedy that I do so much reading in digital form but I have so little insight into my reading on digital devices. Not only would my individual data be very interesting but I would love to look at the aggregate data, and look for the general patterns in how people read books, and to find the suggestions and recommendations that could come out of it. I would love to understand the slow sections and fast sections, and which books seem to drag on for readers.
Data is increasingly informing all sides of the creative sectors, from music to design. Is there a particular project which you think successfully pushes the art of using data to new heights of success?
I am a huge fan of Selfiecity, and love some of the tools they provide for cutting the data and for exploring it on your own.
What do you predict for the next ten years for the quantifiable self and the implications of data and society?
I anticipate that there will only be more and more personal data generated as we move from external wearables to internal wearables. This will provide much more insight into the way our bodies work, and our health on a moment to moment basis. I hope that people integrate it into their lives and make healthier decisions and are able to have tools to understand and explore this data.