"We are all creating data almost just by breathing: our purchases, our movements through the city, our explorations across the internet all contribute to the ‘data trail’ we leave in our wake..."
Giorgia Lupi and Stefanie Posavec are two artists living on either side of the Atlantic. For Dear Data, each week throughout a year they collected and measured different types of data relating to their lives. They then represented it as a drawing on a postcard which they sent to each other as a type of “slow data” transmission.
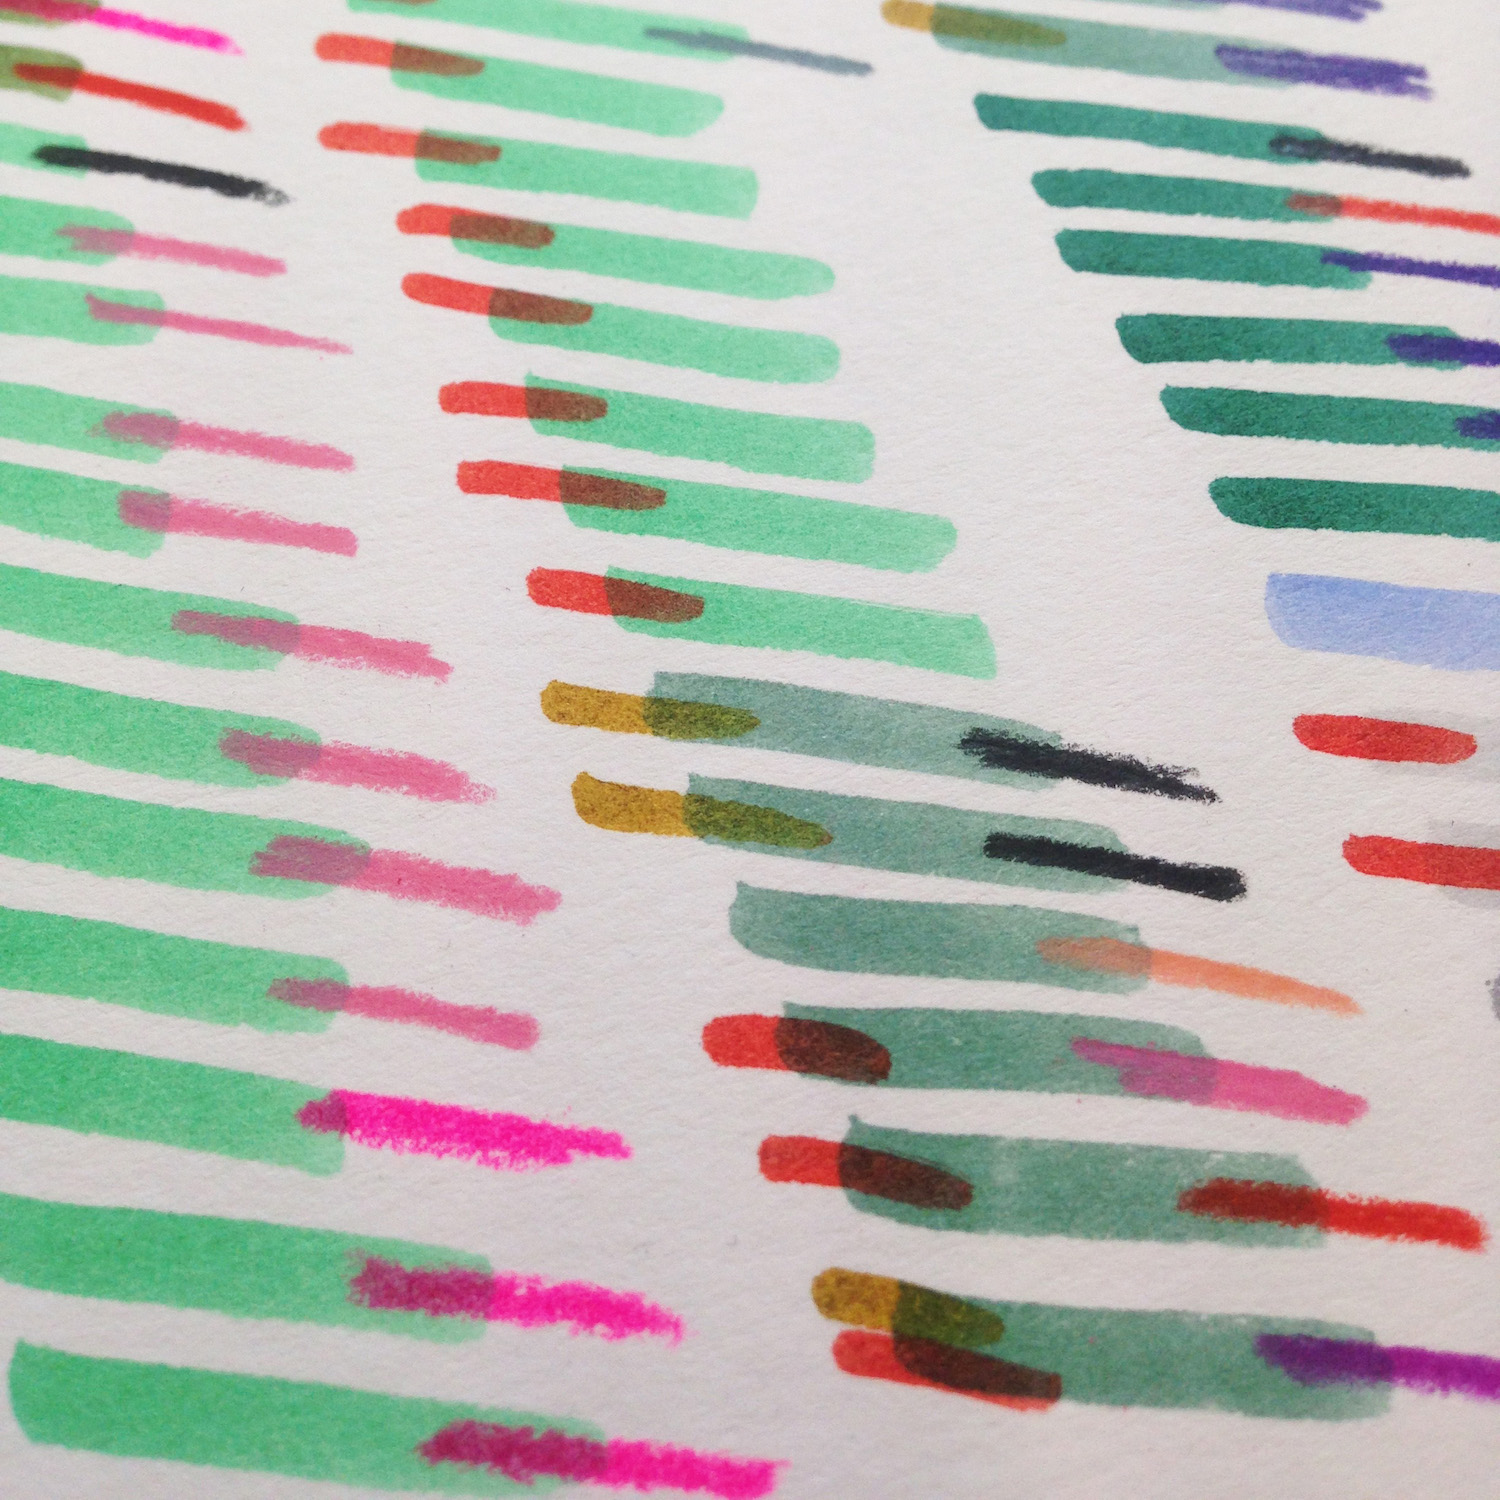
We invited them to take over the Somerset House Instagram account – see their images from the takeover below.
When did you first conceive of the idea for Dear Data?
We had only met twice in person when a plan to collaborate was hatched (as they usually are) over a few beers while we were speaking at Eyeo Festival at the Walker Art Center in 2014. As we both have a very analogue approach to working with data (something relatively unique in our field), we thought it would be interesting to work together to create a data project that showcased our interest in using a slow, manual method of rendering data.
Our biggest constraint became our biggest asset: one of us lives in London and the other in New York, how would we exchange our data-drawings? The idea of sending postcards seemed very compelling, and so Dear Data became our way of getting to know each other, as we liked this idea of sending analog design artifacts as ‘gifts’ to each other.
Why analogue – what impact did your technique of visualising data with hand drawings have on the end result? From the beginning, physicality has played an important part of Dear Data: it was vital to us that our weekly data would be experienced in the form of a postcard, creating the physical interaction of ‘discovering’ while turning the postcard from the back, to the front, and then the back again. We enjoy how this physical output, the physical journey of the postcard across the ocean, and the intrinsic, physical, imperfect nature of an analog drawing challenges the seemingly-cold and impersonal world of digital data through their humanity and warmth. Also, the very act of drawing our data helped us extend ourselves as designers: by removing the technology from the equation, we’ve (each!) been forced to invent 52 different visual languages, as hand-drawing with data leads to designs that are incredibly customized to the data one is counting and working with. A common approach in data visualization design is to visualise data using tools that often return a very standard visualisation, but by hand-drawing our data we’ve been compelled to craft the visual model specifically for the very dataset we were dealing with. At the same time, by radically limiting ourselves and our tools, we were able to ‘spend time’ with our data and were able to understand it on a deeper level.
How did you decide upon the weekly themes?
We started by listing a series of possible topics on a shared spreadsheet, often deciding the week’s theme by texting each other the day before. However, through the year we began to challenge ourselves to find data in less-obvious places and explore new ways of discovering data in our daily stories that might not necessarily be a real-time quantification of our activities.
For example, some of the most recent weekly themes feature an ‘archaeological’ approach where we take the week to survey a specific, non-time-based part of our life, such as a week of gathering data on our wardrobes, or beauty products, our books, and so on.
Or, we also explored ‘performative’ data-gathering, where we would perform acts on purpose to then be able to report them such as a week smiling to strangers (week 28), or a week of trying something new (week 44).
You have only met twice, how quickly did you begin to learn about each other’s habits through the data? What did you discover about each other through the project? This year-long data correspondence definitely brought us very close, we are so present in each other’s lives that it’s easy to forget there is an ocean between us! Through the year, we saw each data postcard as a pretext to log moments of our days and reveal glimpses of our personalities. What interests us most was the composition of the ‘portrait’ of the other person through those fragments of her nature, every week adding little pieces to the puzzle of the other person. We saw each data postcard as the beginning of a conversation, a starting point to ask each other questions about each other’s lives.
We started to understand the nature of the other person pretty quickly, we now joke about it and make fun of our discovered differences: Giorgia is generally optimistic, organised and enthusiastic, needing to get things done early, whereas Stefanie is more pessimistic, disorganised, and cynical, pretty laid back about getting things done at the last minute!
However, we both share one main thing in common: we are both design control freaks and obsessives, which can make even a simple font selection become a (friendly) battleground!
What data set did you both find most challenging to visualise over the 52 weeks of the project? G: there has been one particular week that I found incredibly hard because the data-gathering turned out to be very intrusive in my life at that moment. It was week 36, where we tracked our “indecisions”. That week my grandfather passed away, he has been ill for a long time, I saw him for the last time in February during a very quick visit to my family in Italy. This week as his conditions went downhill I seriously considered to buy a last minute flight to pay him a last visit and say goodbye. But I didn’t. So, I felt incredibly undecided whether to go or not before he passed away, and immensely ambivalent on how to feel after that, later in the week. How do I feel about my family? About living so far away and knowing that I won’t be there for emergencies? How do I feel about my loss, about not seeing him again? I found this week being the most invasive since we started Dear Data, not only I was struggling with my life hesitancies, I also had to focus on them since I needed to record. I was really overwhelmed. On the other hand now I see my postcard as a sort of homage to his memory, and to my particular conflict in dealing with our missed goodbye. S: I always found ‘performative’ weeks challenging: where we would gather data on a habit we would like to cultivate in the hopes that the data-gathering would compel us to engage in the behaviour more frequently. Smiling at strangers, being nice to people, trying new things: I dreaded all of these tasks because it meant I would have to interact with people on the street: surely something difficult for any Londoner to do?
Where did you look to for inspiration when creating data visualisations?
G: Before sitting down and crafting my postcards I like to get-lost in images, as I actually always do in my daily job before starting to design. It is my belief that one of the main resources for a designer is understanding where and how to get inspiration from, and how to handle it and channel it into something original and curious yet somehow “familiar”.
To do so, I try hard not to look for inspiration from existing data-visualizations, I feel we need to look somewhere else if we want to explore what can be done in the field: to me “fishing” for visual clues in unusual contexts is an attempt to discover and dissect the aesthetic qualities of all the things we naturally like, in order to be able to abstract them and introduce them as core principles and guidelines in building visual compositions. I am talking about abstract art, but also the repetitive aesthetics of music notation, the abstraction of architectural drawings or scientific diagrams.I ask myself the questions: “What is that I like of what I see? What elements, aspects and features am I appreciating and why?” My take on this is we should actually train ourselves to “see”, and to question ourselves about what we are seeing.
S: I am inspired by patterns in nature (plants, in particular), notations, hand calculation, diagrams, and more. Like Giorgia, I try to find inspiration outside of the field of data visualisation in the hope that I can bring something new to the practice.
What do you hope the project tells us about data in everyday life?
We believe data collected from life can be a snapshot of the world in the same way that a picture can capture a moment in time. Data can describe the hidden patterns found in every aspect of our lives, from our digital existence to the natural world around us. And once you realise that data can be gathered from every single being and thing on the planet, and you know how how to find these invisible numbers, you begin to see these numbers everywhere, in everything. We hope that by highlighting the ubiquitous, almost domestic nature of data our work is a friendly way for a wider audience to learn about data, in the hopes that this will function as a ‘stepping-stone’ for their interest/engagement in some of the bigger issues surrounding data (such as big data and data privacy) in society today.
What do you think of the world which now let’s us track, measure, monitor and analyse our every move?
We all know we are all creating data almost just by breathing: our purchases, our movements through the city, our explorations across the internet all contribute to the ‘data trail’ we leave in our wake as we move through life. To gain real meaning from these data sets, anyone who’s interested in their data should really focus and engage in a practice of sense-making, of interpretations of those numbers according to one’s personal story, behavior and routine.
How is Dear Data part of your wider design and artistic practice?
G: Dear Data has been a concrete reminder of how data are not only numbers, and they are always a placeholders for something else: people, behaviors. In my day job I direct my own design company and we work with data all the times creating data-driven digital tools and interfaces for our clients. It is truly important even when working with digital material to have the final goal in mind: reconnect data to what they stand for, and Dear Data has tremendously helped me focus on it.
S: Dear Data has inspired me to see drawing as another option when it comes to responding to creative data commissions. I’ve already created one drawn commission already: a series of 1,000 small drawings visualising data from the 1,000 most frequently-used words in the English language for the British Pavilion at the Guadalajara Book Fair this December.